의곡육교
- 공유 링크 만들기
- X
- 이메일
- 기타 앱

- 공유 링크 만들기
- X
- 이메일
- 기타 앱
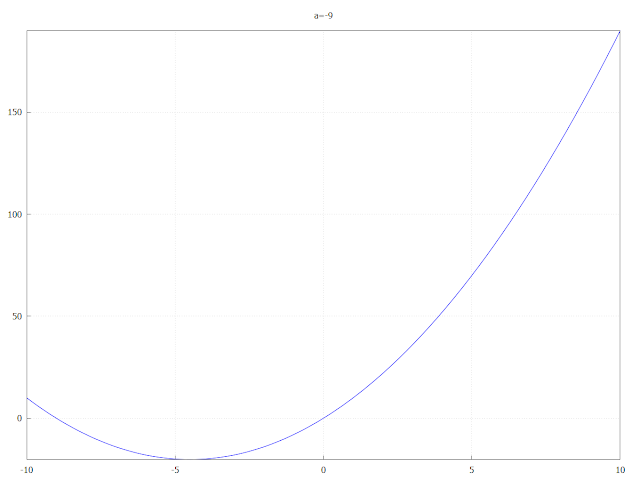
In order to visualize how a parameter affects an equation wxMaxima provides commands that start with "with_slider_" and that create animations.
One example would be:
매개변수가 방정식에 어떤 영향을 미치는지 시각화하기 위해 wxMaxima는 "with_slider_"로 시작하여 애니메이션을 생성하는 명령을 제공합니다. 한 가지 예는 다음과 같습니다:
with_slider_draw(
a,[-16,-9,-4,-2,0,1,2,3,4,5,6,7],
title=concat("a=",a),
grid=true,
explicit(
x^2-a*x,
x,-10,10
)
);
Tip of the day

댓글
댓글 쓰기